Published by
Stanford Medicine

Category

Imaging

Imaging, Neuroscience, Pediatrics, Research, Science, Stanford News

Peering into the brain to predict kids’ responses to math tutoring

peering-into-the-brain-to-predict-kids-responses-to-math-tutoring

Third grade is a critical year for learning arithmetic facts, but while math comes easily to some children, others struggle to master the basics.

Now, researchers at Stanford have new insight into what separates adept young math students from those who have difficulty. The difference, described in a paper published today in the Proceedings of the National Academy of Sciences, can’t be detected with traditional intelligence measures such as IQ tests. But it shows up clearly on brain scans, as the new study’s senior author explained in our press release:

“What was really surprising was that intrinsic brain measures can predict change — we can actually predict how much a child is going to learn during eight weeks of math tutoring based on measures of brain structure and connectivity,” said Vinod Menon, PhD, the study’s senior author and a professor of psychiatry and behavioral sciences.

Menon’s research team conducted structural and functional MRI brain scans before third-grade students received 8 weeks of individualized math tutoring. The tutoring followed a well-validated format, combining instruction on math concepts with practice of math problems emphasizing speed. All the children who received math tutoring improved their math performance, but the performance improvements varied a lot — from 8 percent to 198 percent.

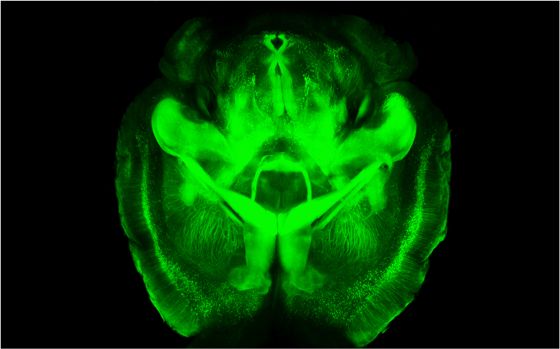
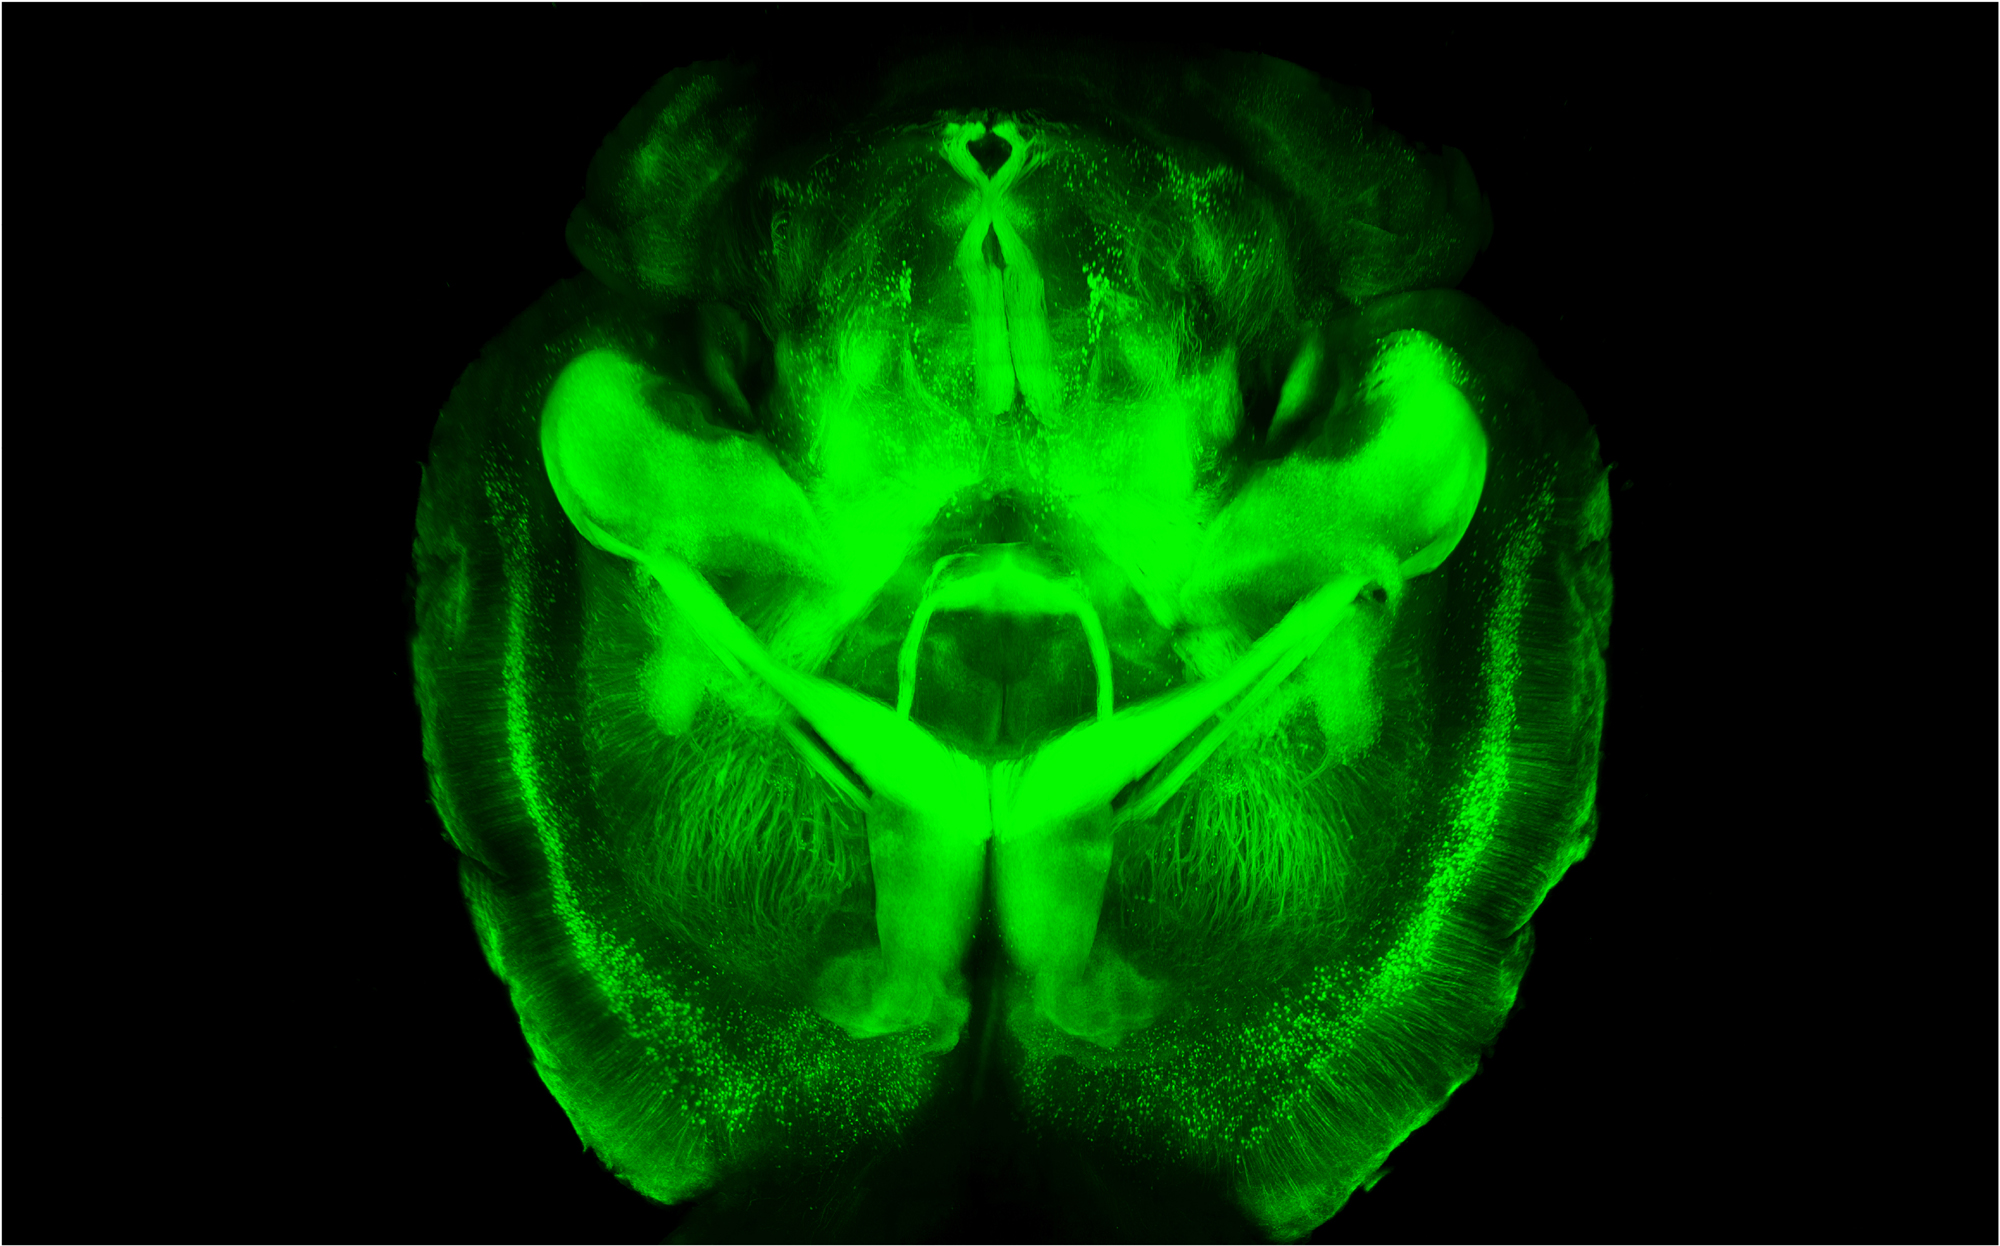
A few specific brain characteristics were particularly good at predicting which kids would benefit most from tutoring. In particular, a larger and better-wired hippocampus predicted performance improvements. The brain structures highlighted in the study are implicated in forming memories, and differ from the portions of the brain that adults use when they are learning about math. The fact that these systems are involved helps to explain why the combination of conceptual explanations and sped-up practice that the study’s tutors used is effective, Menon explained:

“Memory resources provided by the hippocampal system create a scaffold for learning math in the developing brain,” Menon said. “Our findings suggest that, while conceptual knowledge about numbers is necessary for math learning, repeated, speeded practice and testing of simple number combinations is also needed to encode facts and encourage children’s reliance on retrieval — the most efficient strategy for answering simple arithmetic problems.” Once kids are able to pull up answers to basic arithmetic problems automatically from memory, their brains can tackle more complex problems.

Next, the researchers plan to examine how brain wiring changes over the course of tutoring. The new findings could also help educators understand the basis for math learning disabilities, and may even provide a foundation for figuring out what kind of instruction could help children overcome these problems.

Previously: New research tracks “math anxiety” in the brain and We’ve got your number: Exact spot in brain where numeral recognition takes place revealed
Photo by Canadian Pacific

Image of the Week, Imaging, Neuroscience, Research, Stanford News

Image of the Week: 3-D rendering of a clarified brain

image-of-the-week-3-d-rendering-of-a-clarified-brain

Earlier this week, fellow Scope contributor Bruce Goldman reported on a paradigm-shifting process developed by Stanford psychiatrist and bioengineer Karl Deisseroth, MD, PhD, and colleagues. Using the process, called CLARITY, scientists were able to turn a mouse brain into an “optically transparent, histochemically permeable replica of itself.”

National Institutes of Health Director Francis Collins, MD, PhD, commented on the breakthrough in a recent blog post, saying:

CLARITY is powerful. It will enable researchers to study neurological diseases and disorders, focusing on diseased or damaged structures without losing a global perspective. That’s something we’ve never before been able to do in three dimensions.

This haunting image depicts a three-dimensional rendering of clarified brain imaged from the ventral half. To fully experience the new method’s awe-inspiring capabilities, watch this fly-through video.

Previously: Scientific community (and Twitter) buzzing over Stanford’s see-through brain, Lightning strikes twice: Optogenetics pioneer Karl Deisseroth’s newest technique renders tissues transparent, yet structurally intact and Peering deeply – and quite literally – into
Photo by Deisseroth lab

Behavioral Science, Imaging, Medicine and Society, Neuroscience, Research, Stanford News

Brains of different people listening to the same piece of music actually respond in the same way

brains-of-different-people-listening-to-the-same-piece-of-music-actually-respond-in-the-same-way

Ever wonder - say, while sitting quietly in a concert hall or screaming your lungs out in a crowded ampitheater - whether the musical experience you’re having is anything like that of the person three seats up or three sheets to the wind on your right?

A partial answer is in: Our brains process music in pretty much the same way, providing it’s got the requisite combination of components (rhythm, melody, harmony, etc.), according to Stanford neuroscientist Vinod Menon, PhD. In a just-published study, Menon’s group monitored several healthy peoples’ brains while these subjects listened to the same piece of music. As the music played on, activity in a broadly distributed network of neuroanatomically connected brain areas waxed and waned very similarly for each listener. This synchrony among individual responses was absent when participants listened to “pseudomusic” stripped of either rhythmic or tonal characteristics.

The inter-subject synchronization extended to the brain’s movement-planning zone. Evolution, it seems, has designed us this way. As I wrote in my release about the study:

[O]ur brains respond naturally to musical stimulation by foreshadowing movements that typically accompany music listening: clapping, dancing, marching, singing or head-bobbing. The apparently similar activation patterns among normal individuals make it more likely our movements will be socially coordinated.

It’s easy to imagine the survival value of coordinated movement in response to auditory cues. Hunting, gathering, warmaking - all benefit from choreography. That would objectively explain how people who run, shout and pump their fists in synch might win the evolutionary race.

But about the subjective aspect of this synchronization, I’m not so sure.

Look. It’s important that our brains respond similarly to identical stimuli. But what about our minds? In the house of mirrors that is our consciousness, how can we know whether music sounds the same, or color looks the same, to different people?

This takes me back to long ago when, as a philosophy major at the University of Wisconsin, I flunked a course in epistemology. That’s the philosophy of what we know and how we know it, and what we think we know that, actually, we don’t. Turns out I didn’t know much.

One day, the professor - a tweedy, pipe-puffing Princeton man who paced the room in an elbow-patch-bedecked jacket - shouted to the motley assortment of assembled esistentialist ectomorphs: “I PROPOSE. THAT. WHEN I SAY: ‘BLUE!’ ALL OF YOU. SEE. EXACTLY. THE SAME. COLOR!!!”

He paused. “Refute. That. Hypothesis,” he snarled, taking a toke from his pugnacious pipe.

I didn’t raise my hand. It raised itself. He called on me. “I see the same color slightly differently with each eye,” I said, illustrating my claim with alternating winks of my left and right eye. Seemed like a slam-dunk to this Milwaukee boy. (It also happened to be true.)

He glared at me, cross-examined me fiendishly for five long minutes and, striding to the blackboard (I did tell you this was long ago), multiplied the number of minutes we had dueled by the dwindled number of my classmates and thundered: “You’ve wasted 45 student-minutes of class time!”

It was right about then that I started thinking maybe I should switch to science.

So, what is “music,” really? Well, we don’t really know. But whatever it is, it makes us wanna shout, kick our heels up and shout, throw our hands up and shout, throw our heads back and shout.

Previously: New research tracks “math anxiety” in the brain, Why memory and math don’t mix: They require opposing states of the same circuitry and Can playing familiar music boost cognitive response among patients with brain damage?
Photo by gilmorec

Bioengineering, Imaging, Neuroscience, Research, Stanford News

Scientific community (and Twitter) buzzing over Stanford’s see-through brain

scientific-community-and-twitter-buzzing-over-stanfords-see-through-brain

Yesterday’s announcement about Stanford scientists developing a process that renders tissue, specifically a mouse brain, transparent spurred a significant amount of excitement among both the scientific community and general public. We’ve captured the reactions in tweets, blog posts, videos and quotes from new articles on our Storify page.

Among the video content is an interview with Karl Deisseroth, MD, PhD, explaining the work, a fly-through of a complete mouse brain using fluorescent imaging, and commentary from Michelle Freund, PhD, a project officer in the National Institute of Mental Health Division of Neuroscience and Basic Behavioral Science, discussing the significance of the work. Mixed in with the videos are remarks from experts about how the breakthrough will advance the field of neuroscience and other research applications and candid comments from Twitter users. We hope the collection provides a broader perspective on the research and its potential to revolutionize cell biology.

Previously: Lightning strikes twice: Optogenetics pioneer Karl Deisseroth’s newest technique renders tissues transparent, yet structurally intact and Peering deeply – and quite literally – into the intact brain: A video fly-through

Imaging, In the News, Neuroscience, Research, Stanford News

Neuroscience studies often underpowered, say researchers at Stanford, Bristol

neuroscience-studies-often-underpowered-say-researchers-at-stanford-bristol

I’m ashamed to admit that the study of statistics was regarded (at least by me) as a necessary evil when I was in graduate school. I vaguely remember one course that attempted to teach a lecture hall of sleepy, stressed-out students how to calculate p values, the differences between retrospective, prospective and case-control studies, and the nuances between sensitivity and specificity. And don’t even get me started on odds ratios. Can you tell I’m still a bit fuzzy? In fact, I keep a reference guide at my desk for help (which I have to consult embarrassingly often).

Statistics might be dull, but there’s no denying its importance in scientific research - and the fallout when scientists fail to appreciate its power. Now, Stanford researcher John Ioannidis, MD, DSci, (of the “Why most published research findings are false” fame) has joined forces with Marcus Munafo, PhD, and others at the University of Bristol to publish a new study in in Nature Reviews Neuroscience (subscription required) delineating the statistical flaws in many published neuroscience studies. Essentially, the researchers found that, although many scientists realize that an under-powered study (for example, one with too few study subjects to adequately capture the phenomena being investigated) is less likely to find statistically significant results, they don’t necessary realize the converse: that any statistically significant finding from such a study is less likely to represent a true effect.

Stellar science blogger Ed Yong explains the sobering implications in an excellent post today:

Statistical power refers to the odds that a study will find an effect—say, whether antipsychotic drugs affect schizophrenia symptoms, or whether impulsivity is linked to addiction—assuming those effects exist. Most scientists regard a power of 80 percent as adequate—that gives you a 4 in 5 chance of finding an effect if there’s one to be found. But the studies that Munafo’s team examined tended to be so small that they had an average (median) power of just 21 percent. At that level, if you ran the same experiment five times, you’d only find an effect on one of those. The other four tries would be wasted.

But if studies are generally underpowered, there are more worrying connotations beyond missed opportunities. It means that when scientists do claim to have found effects—that is, if experiments seem to “work”—the results are less likely to be real. And it means that if the results are actually real, they’re probably bigger than they should be. As the team writes, this so-called “winner’s curse” means that “a ‘lucky’ scientist who makes the discovery in a small study is cursed by finding an inflated effect.”

I encourage you to read all of Ed’s post, which includes multiple comments from Ioannidis, Munafo and other researchers uninvolved in the study. It’s a fascinating analysis of why many studies are designed as they are, and it discusses some of the obstacles that must be overcome to improve their fidelity. And don’t overlook the comment stream, which is currently hosting a rich discussion among scientists in the field.

Previously: NIH funding mechanism “totally broken” says Stanford researcher, Research shows small studies may overestimate the effects of many medical interventions and Animal studies: necessary but often flawed, says Stanford’s Ioannidis
Photo by futureshape

Aging, Imaging, Neuroscience, Research, Stroke

Researchers combine brain-imaging tool and stroke test to detect early signs of dementia

researchers-combine-brain-imaging-tool-and-stroke-test-to-detect-early-signs-of-dementia

Previous research has shown that elderly patients with an increased risk of stroke have an accelerated rate of cognitive decline. Now researchers at University of California, Los Angeles have combined a brain-imaging tool and stroke risk assessment to detect signs of cognitive decline in people without current symptoms of dementia.

In the study, a group of healthy and mildly cognitively impaired individuals with an average age of 63 completed neuropsychological testing and physical assessments to determine their stroke risk using the Framingham Stroke Risk Score. Additionally, researchers injected participants with a chemical marker called FDDNP and used positron emission tomography (PET) to image their brains. According to a university release:

The study found that greater stroke risk was significantly related to lower performance in several cognitive areas, including language, attention, information-processing speed, memory, visual-spatial functioning (e.g., ability to read a map), problem-solving and verbal reasoning.

The researchers also observed that FDDNP binding levels in the brain correlated with participants’ cognitive performance. For example, volunteers who had greater difficulties with problem-solving and language displayed higher levels of the FDDNP marker in areas of their brain that control those cognitive activities.

“Our findings demonstrate that the effects of elevated vascular risk, along with evidence of plaques and tangles, is apparent early on, even before vascular damage has occurred or a diagnosis of dementia has been confirmed,” said the study’s senior author, Dr. Gary Small… Researchers found that several individual factors in the stroke assessment stood out as predictors of decline in cognitive function, including age, systolic blood pressure and use of blood pressure–related medications.

The work appears in the April issue of the Journal of Alzheimer’s Disease.

Previously: How new imaging technologies may help advance early diagnosis of Alzheimer’s, Alanna Shaikh talks about preparing for Alzheimer’s, Common genetic Alzheimer’s risk factor disrupts healthy older women’s brain function, but not men’s and Alzheimer’s disease: Why research is so critical

Cancer, Health Policy, Imaging, Stanford News, Videos, Women's Health

California’s new law on dense breast notification: What it means for women

californias-new-law-on-dense-breast-notification-what-it-means-for-women

Effective today, radiologists across California will be required by law to notify women when their mammography screening shows they have dense breast tissue. Approximately 50 percent of women have dense breast tissue - more fibrograndular tissue than fatty tissue as seen on a mammogram - so falling into this category is quite normal.

If you’re a woman with dense breast tissue, you’ll receive a letter in the mail that includes an explanation that this is a risk factor for developing breast cancer and that having such tissue may make it more difficult to detect a tumor. (However, having dense breast tissue is only a small risk factor for developing breast cancer and mammography is still considered the gold standard in breast-cancer screening.)

While this notification is meant to educate women about their own bodies and empower them to make better health-care decisions, it could also result in needlessly alarming or confusing patients. It’s important that women understand why they’re receiving this information and what they can do about it, which is why Stanford Hospital prepared the video above.

Bioengineering, Cardiovascular Medicine, Imaging, Research, Stanford News, Stem Cells

Nano-hitchhikers ride stem cells into heart, let researchers watch in real time and weeks later

nano-hitchhikers-ride-stem-cells-into-heart-let-researchers-watch-in-real-time-and-weeks-later

Stem-cell therapy for damaged hearts is a brilliant idea whose time has not yet come. To date, human and animal trials - there have been quite a few - in which stem cells were injected into cardiac tissue to treat severe heart attacks or substantial heart failure have mostly produced poor results.

Stanford’s Sam Gambhir, PhD, MD, who heads the medical school’s Department of Radiology, thinks he knows part of the reason why, and he may have found a way around it.

At present, there’s no way to ensure against faulty initial placement, he told me in an interview about his study describing the proposed solution, just published in Science Translational Medicine. “You can use ultrasound to visualize the needle through which you deliver stem cells to the heart. But once those cells leave the needle, you’ve lost track of them.”

In my release about the work, I wrote:

As a result, key questions go unanswered: Did the cells actually get to the heart wall? If they did, did they stay there, or did they diffuse away from the heart? If they got there and remained there, for how long did they stay alive? Did they replicate and develop into heart tissue?

Gammbhir’s lab has figured out a way to “mark” stem cells before infusing them into the heart, rendering them visible to standard ultrasound as they’re squeezed out of the needle. The key was to invent an innovative imaging agent, in the form of nanoparticles whose diameters clustered just below one-third of a micron — less than one-three-thousandth the width of a human hair. The nanoparticles’ main ingredient, silica, shows up on ultrasound. The particles were also doped with the rare-earth element gadolinium, so they can also be observed using MRI.

It turns out that mesenchymal stem cells — a class of cells often used in heart-regeneration research because they can differentiate into beating heart cells and because they can sometimes be harvested directly from the patients themselves, avoiding possible immune-compatibility problems — were happy to gobble up the nanoparticles in a lab dish without losing any of their ability to survive, thrive, and replicate themselves.

When Gambhir and his associates infused these nanoparticle-loaded stem cells into the hearts of healthy mice, they were indeed able to monitor the cells via ultrasound after they left the needle tip, guide them to the targeted area of the heart wall, and still get a strong MRI signal from the cells two weeks later.

Stem-cell therapy for damaged hearts isn’t going to be cheap anytime soon. (A wild guess of, say, $50,000 per procedure is probably not too far off the mark.) But a one-time delivery, if it worked, could replace a lifetime of constant drug administration. Adding what Gambhir estimates might be another $2,500 a pop for the added imaging capability is likely to be hugely cost-effective, because it could greatly improve the odds of the procedure’s success.

Previously: Nanoparticles home in on human tumors growing in mice’s brains, increase accuracy of surgical removal, Nanomedicine moves ones step closer to reality and Developing a new molecular imaging system and technique for early disease detection
Photo by miguelb

Imaging, Neuroscience, Research, Videos

Cellular-level video of brain activity in a zebrafish

cellular-level-video-of-brain-activity-in-a-zebrafish

Researchers at Howard Hughes Medical Institute have mapped most of a zebrafish brain using a technique that provides an illuminated view of individual cells and shows how the neurons are firing. The findings could prove useful in better understanding the brain’s function. According to a recent Nature news article:

It is the first time that researchers have been able to image an entire vertebrate brain at the level of single cells.

The researchers are able to record activity across the whole fish brain almost every second, detecting 80% of its 100,000 neurons. (The rest lie in hard-to-access areas, such as between the eyes; their activity is visible but cannot be pinned down to single cells.)

The resolution offered by the zebrafish study will enable researchers to understand how different regions of the brain work together, says [Howard Hughes Medical Institute neurobiologist Misha Ahrens, PhD]. With conventional techniques, imaging even 2,000 neurons at once is difficult, so researchers must pick and choose which to look at, and extrapolate. Now, he says, “you don’t need to guess what is happening — you can see it”.

The increased imaging power could, for example, help to explain how the brain coordinates movement, consolidates learning or processes sights and smells.

Results of the study were published yesterday in Nature Methods.

Previously: New tool for reading brain activity of mice could advance study of neurodegenerative diseases, Animal study shows sleeping brain behaves as if it’s remembering, Scientists turn mouse memory on and off with the flick of a switch and Zebrafish shed light on what happens when we sleep

Image of the Week, Imaging, Pediatrics, Pregnancy

Image of the Week: 3D model of the fetal heart

image-of-the-week-3d-model-of-the-fetal-heart

By combining scans of healthy fetuses in the womb, including that of a woman who agreed to weekly electrocardiography scans starting at 18 weeks gestation until just prior to delivery, a team of UK-based researchers have created a 3D computerized model of the activity and architecture of human heart development. Their findings were published Thursday in the Journal of the Royal Society Interface Focus. According to a University of Leeds release:

Although [researchers] saw four clearly defined chambers in the foetal heart from the eighth week of pregnancy, they did not find organised muscle tissue until the 20th week, much later than expected.

Developing an accurate, computerised simulation of the foetal heart is critical to understanding normal heart development in the womb and, eventually, to opening new ways of detecting and dealing with some functional abnormalities early in pregnancy.

The above image shows an MRI scan of the heart of a 139-day-old fetus as seen from the top, with the muscle cells highlighted in red. An accompanying video illustrates fetal hearts at different stages of gestation.

Via Futurity
Photo by University of Leeds

Stanford Medicine Resources: