As digital information becomes increasingly cheap and
ubiquitous, how will we keep abreast with the rising tide of
data? My research group investigates the perceptual,
cognitive, and social factors involved in making sense of
large data collections, and develops novel interactive
systems for visual analysis and communication.
about projects vita bio students
latest + greatest
Data-Driven Documents (D3) is a framework for interactive browser-native visualization that builds on the approach of our Protovis language.

Given a bitmap image of a chart, ReVision applies computer vision methods to identify the visualization type, extract the underlying data, and generate redesigned visualizations.

Wrangler is a system for data transformation that combines direct manipulation of data tables with automatic transform inference and preview visualizations.
I recently presented A Brief History of Data Visualization at the Stanford HCI seminar.
A video
is on the internets, as is an earlier talk on interactive visualization.
|
selected projects

Collaborative VisualizationSocial data analysis using interactive visualizations on the web.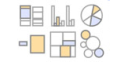
Graphical PerceptionStudying human perception to inform visualization design, often using crowdsourcing methods.
Animation in Data GraphicsUsing animation to improve perceptionof transitions in data graphics. |